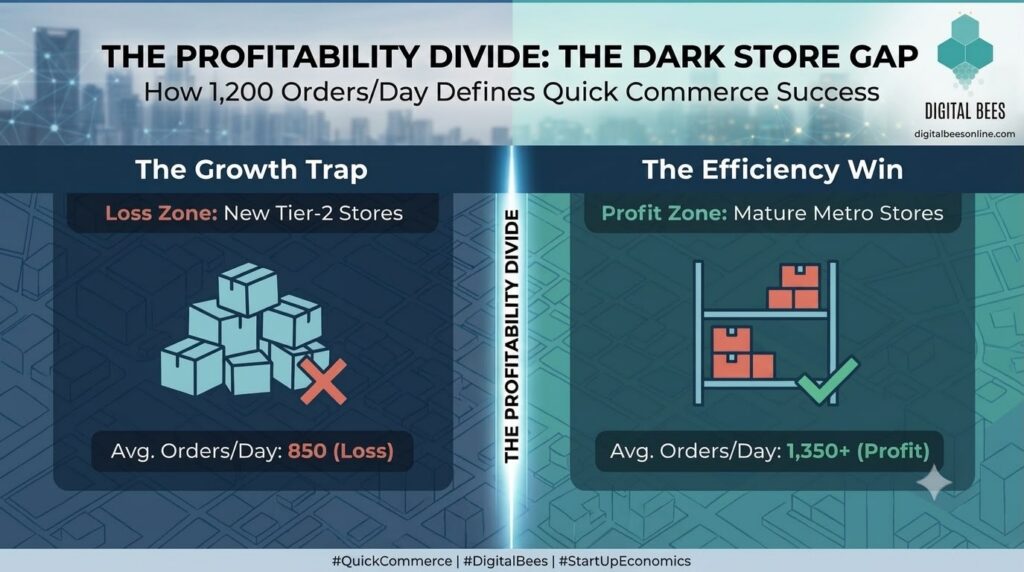
Dark store profitability is quietly becoming the real scoreboard in India's quick commerce race. While headline numbers celebrate rapid dark store expansion, the store-level P&L tells a far less flattering story — one where new tier-2 outlets average just ~850 orders/day against a mature metro breakeven of 1,200–1,500. For founders and operators, that gap isn't a rounding error; it's the line between a self-funding store and one bleeding cash daily.
Opening more stores isn't a strategy on its own — it's a bet. And like any bet, the odds only improve when the fundamentals behind them are sound. Here's what actually separates the winners from the ones quietly burning capital.
Demand Forecasting
Dead stock and stockouts are two sides of the same forecasting problem, and both quietly erode margins long before a store gets anywhere near breakeven.
- Hyperlocal demand mapping: Order patterns vary block by block, not just city by city — generic city-level forecasts miss this entirely.
- SKU-level velocity tracking: Fast-moving vs. slow-moving inventory needs different reorder cycles, especially in the first 90 days of a new store's life.
- Seasonal and event-based spikes: Festivals, weather shifts, and local events can swing demand 2-3x, and stores without predictive buffers either overstock or run empty at the worst time.
Sharper forecasting isn't just an ops nicety — it's directly tied to how fast a store climbs toward its breakeven order volume. Brands building this kind of data-driven demand engine often lean on structuredSEO and AEO strategies to also capture high-intent local search traffic that feeds real-time demand signals.
City and Pincode Selection
The single biggest driver of time-to-breakeven isn't operational — it's the site selection decision made before the store ever opens.
- Density over headline population: A pincode with fewer people but higher order frequency often outperforms a "bigger" but sparser catchment area.
- Competitive saturation checks: Entering a pincode already crowded with three other dark stores splits demand no forecasting model can fix.
- Capex-to-catchment ratio: Real estate and setup costs need to be weighed against realistic order ceilings for that specific micro-market, not city-wide averages.
Getting this decision right before committing capex is what separates a store that reaches 1,200 orders/day in months from one that plateaus at 850 indefinitely.
Operational Efficiency
Even a well-located, well-forecasted store can lose weeks of runway to operational drag that never shows up in a pitch deck.
- Pick-and-pack time optimization: Shaving even 30-60 seconds off average fulfillment time compounds fast across thousands of daily orders.
- Delivery radius discipline: Tighter, smarter delivery zones reduce rider idle time and improve orders-per-rider-hour.
- Staffing-to-demand alignment: Matching shift patterns to actual order curves (not assumed peak hours) cuts both overstaffing costs and missed-order risk.
Tight ops execution is often the fastest lever available to founders — it doesn't require new capex, just sharper systems. A conversion-focusedwebsite and app experience also plays a quiet role here, reducing drop-off between browse and order and easing pressure on backend ops.
Expansion Discipline
The hardest — and most valuable — discipline in quick commerce isn't opening stores. It's knowing when not to.
- Breakeven-gated rollouts: New stores shouldn't get greenlit until the previous cohort has proven its unit economics hold.
- Kill criteria, not just launch criteria: Winning operators define upfront what underperformance looks like and act on it, rather than waiting out a "growth phase.
- Capital allocation toward proof, not projection: Reinvesting in stores that are close to breakeven usually outperforms funding new, unproven locations.
This is where growth-stage discipline diverges sharply from growth-stage optics — and it's usually the difference founders discover only after a funding winter forces the question.
The Breakeven Gap
The 350-650 order/day gap between mature metro stores and new tier-2 stores isn't just a performance stat — it's the clearest early warning signal available to operators.
- Cohort-level tracking: Comparing new stores against the trajectory of past cohorts (not just against each other) reveals whether the gap is closing on schedule or stalling.
- Time-to-1,000 as a leading indicator: Stores that cross 1,000 orders/day within the first few months are far more likely to reach full breakeven than those that plateau early.
- Cash runway mapped to the gap: Every day a store sits below breakeven has a real cost — modeling that burn against the gap keeps expansion decisions grounded in cash reality, not growth optimism.
Treating this gap as a diagnostic tool, not just a reporting metric, is what lets founders catch underperforming stores before they become expensive lessons.
Ready to Build Growth Systems That Actually Hold Up?
If your business needs demand forecasting, performance marketing, or a conversion-ready digital presence to support smarter expansion decisions,book a call with Digital Bees and let's build a growth system designed for real unit economics — not just headline numbers.